- Fourier Linear Combiner (FLC)
- Weighted-frequency Fourier Linear Combiner (WFLC)
- Bandlimited Multiple Fourier Linear Combiner (BMFLC)
အစရှိတဲ့ filter တွေ အကြောင်း ပြောချင်ပါတယ်။ FLC က frequency သိတဲ့ periodic signal တခုရဲ့ amplitude နဲ့ phase ကို least mean square (LMS) algorithm သုံးပြီး adapt လုပ်ယူ ခန့်မှန်းတာပါ။ WFLC ကတော့ FLC ကို ထပ်မံဖြည့်စွက်ပြီး frequency ကိုပါ သိစရာ မလိုပါဘူး။ ဒါကြောင့် FLC လို frequency အသေဖြစ်စရာ မလိုပဲ၊ frequency ပြောင်းလဲနေ တဲ့ reference signal တွေကို ပါ adapt လုပ်နိုင်ပါတယ်။ WFLC ရဲ့ အားနည်းချက်က reference signal မှာ dominant frequency တွေ အများကြီး ပါနေရင် အလုပ်ကောင်းကောင်း မလုပ်နိုင်တော့ ပါဘူး။ အဲ့ဒါကို ဖြေရှင်းဖို့ အတွက် ကြိုတင်သတ်မှတ်ထားတဲ့ frequency band ထဲက dominant frequency တွေ အများကြီးကို track လုပ်နိုင်တဲ့ BMFLC ကို သုံးနိုင်ပါတယ်။
Setup
Arduino zero pro ကို သုံးပြီး စမ်းကြည့်ပါမယ်။ Code တွေကို အခြား platform ပေါ်တွေမှာ ပါ အလွယ် တကူ ယူသုံးနိုင်အောင် C နဲ့ပဲ ရေးလိုက်ပါတယ်။ ပထမ အနေနဲ့ reference signal ကို generate လုပ်ကြည့်ပြီး noise ပေါင်းထည့်ပါမယ်။ အဲဒီ signal ကိုပဲ adaptive filter နဲ့ စစ်ပြီးတဲ့အခါ serial plotter မှာ မူရင်း reference signal နဲ့ နှိုင်းယှဉ် plot လုပ်ကြည့်ပါမယ်။ အခုနောက်ပိုင်း Arduino IDE တွေမှာ Serial Monitor နဲ့ အတူ၊ Serial Plotter ပါပါလာတော့ အဝင် signal ပြောင်းသွားတဲ့အခါ adaptive filter က ဘယ်လို adaptive လုပ်သွားတယ် ဆိုတာ serial plotter မှာ ကြည့်ရတာ ပိုပြီး ထင်သာမြင်သာ ရှိပါတယ်။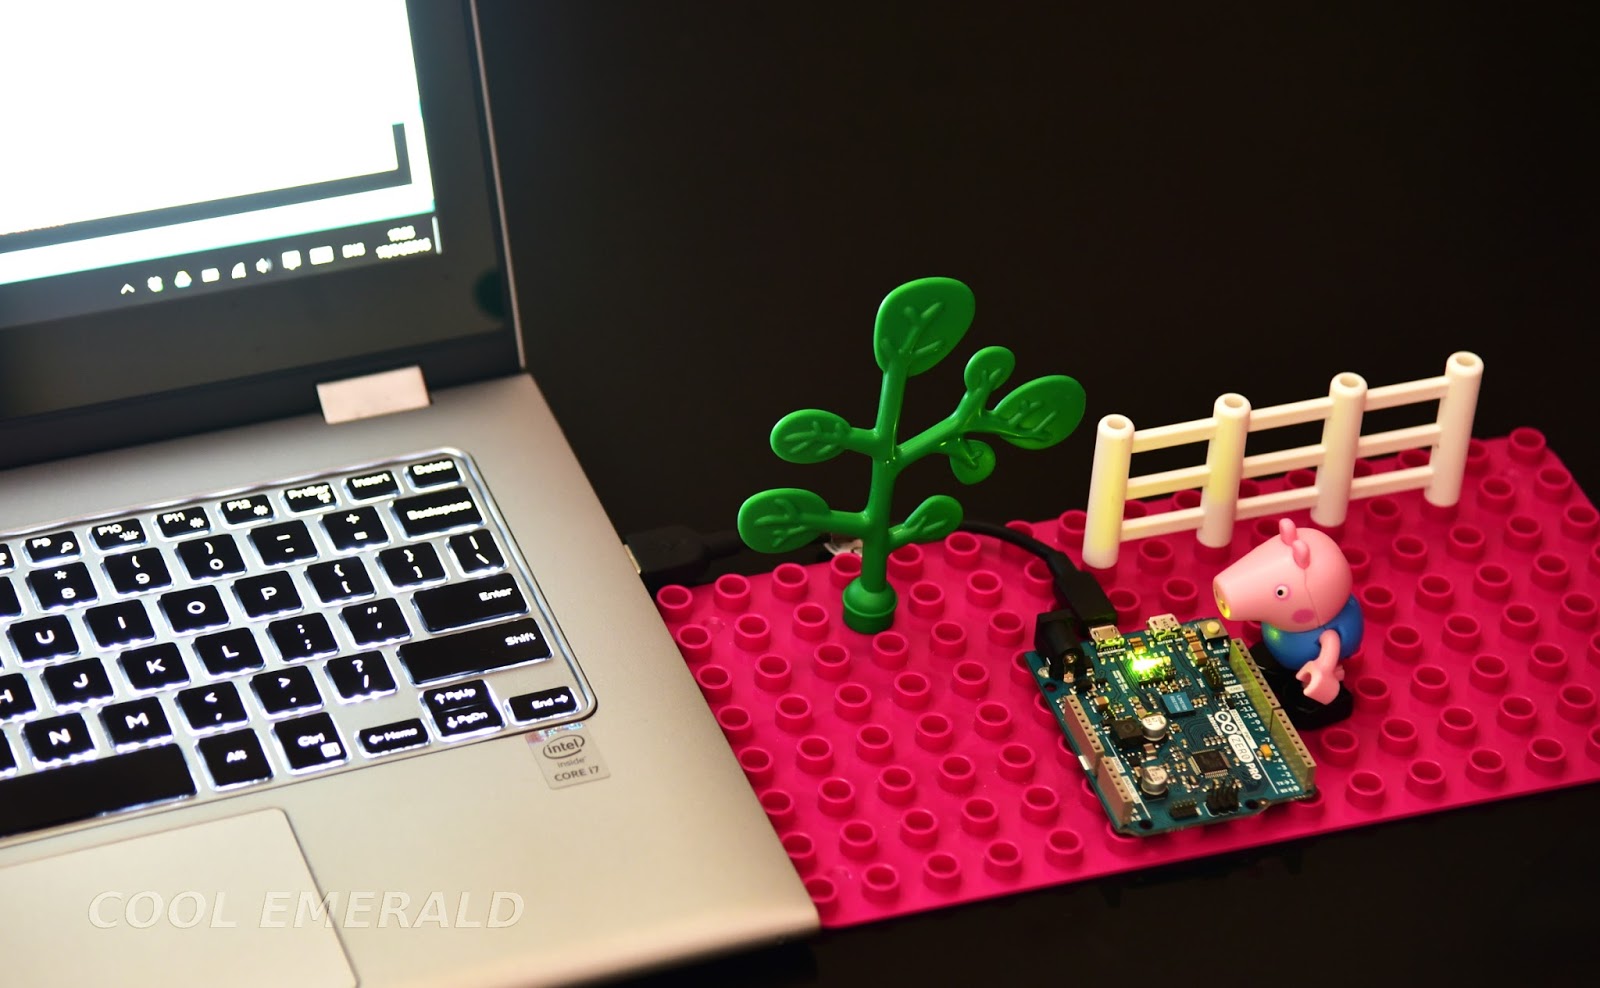
Figure. A simple setup using an Arduino Zero Pro board.


